In this tutorial you will learn about the R Data Reshaping and its application with practical example.
R Data Reshaping
In R, before we perform any analysis over data provided, it must be changed it into required format. Data Reshaping is the process about changing the way data is organized into rows and columns. In data reshaping we take input data as data frame and change or reshape it into required format. Sometimes we may need to convert input data into intermediate format in order to reshape it in required data format.
R comes with a rich set of functions for reshaping data prior to analysis including functions to split, merge and change the rows to columns and vice-versa in a data frame.
R Transpose a Matrix
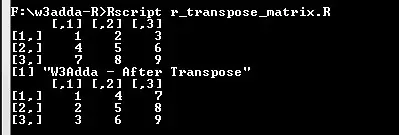
The t() function is used to transpose a matrix or a data frame.
Example:-
|
1 2 3 4 5 |
A <- matrix(c(1:9), nrow = 3, byrow = TRUE) A print("W3Adda - After Transpose") A <- t(A) A |
Output:-

The Reshape Package
In R, we have a “reshape” package which includes a rich set of data reshaping function that makes it easy to perform data analysis.
Melting and Casting
Reshaping of data may involve multiple steps in order to convert input data into required format. We generally melt data so that each row is converted into unique id-variable combination. Then we cast this data into desired format. The functions used to do this are melt() and cast().
Melt Data using melt() function
Example:-
Lets take a sample data set as following –
| id | point | x1 | x2 |
| 1 | 1 | 5 | 6 |
| 1 | 2 | 3 | 5 |
| 2 | 1 | 6 | 1 |
| 2 | 2 | 2 | 4 |
Now, lets melt the above data set using melt() function, melt() function will convert all columns other than id and point into multiple rows.
|
1 2 3 |
# example of melt function library(reshape) mdata <- melt(mydata, id=c("id","point")) |
Output:-
| id | point | variable | value |
| 1 | 1 | x1 | 5 |
| 1 | 2 | x1 | 3 |
| 2 | 1 | x1 | 6 |
| 2 | 2 | x1 | 2 |
| 1 | 1 | x2 | 6 |
| 1 | 2 | x2 | 5 |
| 2 | 1 | x2 | 1 |
| 2 | 2 | x2 | 4 |
Cast Data using cast() function
Now, lets cast the melted data to evaluate mean –
|
1 2 3 4 |
# cast the melted data # cast(data, formula, function) idmeans <- cast(mdata, id~variable, mean) pointmeans <- cast(mdata, point~variable, mean) |
Output:-
idmeans
| id | x1 | x2 |
| 1 | 4 | 5.5 |
| 2 | 4 | 2.5 |
pointmeans
| point | x1 | x2 |
| 1 | 5.5 | 3.5 |
| 2 | 2.5 | 4.5 |
Merging Data Frames
In R, merge() function can be used to merge two data frames. In order to merge data frames they must have same column names on which merging is performed. The merge function is mostly used to merge data frames horizontally. Mostly, merging is performed on one or more common key variables (i.e., an inner join).
Example:-
|
1 2 3 4 |
# merge two data frames by ID total <- merge(dfA,dfB,by="ID") # merge two data frames by ID and Country total <- merge(dfA,dfB,by=c("ID","Country")) |
Joining Vectors using cbind() function
In R, cbind() function is used to join multiple vectors into data frame.
Syntax:-
|
1 |
cbind(x1, x2, ...) |
dfA
| Type | Sex | Exp |
| B | M | 50 |
| A | F | 15 |
dfB
| Age | City |
| 30 | NY |
| 20 | SF |
Example:-
|
1 |
dfC <- cbind(dfA,dfB) |
Output:-
| Type | Sex | Exp | Age | City |
| B | M | 50 | 30 | NY |
| A | F | 15 | 20 | SF |
Joining Data Frame using rbind() function
In R, rbind() function is can be used to join multiple data frame.
dfA
| Type | Sex | Exp |
| B | M | 50 |
| A | F | 15 |
dfB
| Type | Sex | Exp |
| D | F | 10 |
| C | M | 5 |
Example:-
|
1 |
dfC <- rbind(dfA,dfB) |
Output:-
| Type | Sex | Exp |
| B | M | 50 |
| A | F | 15 |
| D | F | 10 |
| C | M | 5 |

